Introduction
The Reactochart is a Library that contains a number of React components which are for graphs and charts and data visualization. The XY Data Components include: Bar, RangeRect, XLine, YLine while the XY Axis Components include: XAxis, XAxisLabels, XAxisTitle, XGrid, XTicks, YAxis, YAxisLabels, YAxisTitle, YGrid, YTicks and the standalone components include: Pie Chart, SandeyDiagram and TreeMap
Site URL: spotify.com/us Developer: github.com/spotify/reactochart Framework: ReactJS **Library: **Reactochart
Purpose of the Application
Spotify is an audio-streaming subscription service. A digital music, podcast, and video service that gives you access to millions of songs and other content from creators all over the world. It is easy to find the right music or podcast every time. This is doubled with the trends and music that top charts so as to give users seamless experience of new and trendy sounds. You can browse through millions of tracks, connect to any browser and can also let Spotify do the work of picking.
Type of Integration used on the website
The Spotify website is built to interact and sync properly with users and their music and podcast choice hence a chart system. Spotify charts come in different types. From axial charts to non- axial charts hence giving vast information on the audio service. Charts are used to check trends, latest songs, age ranges and figures.
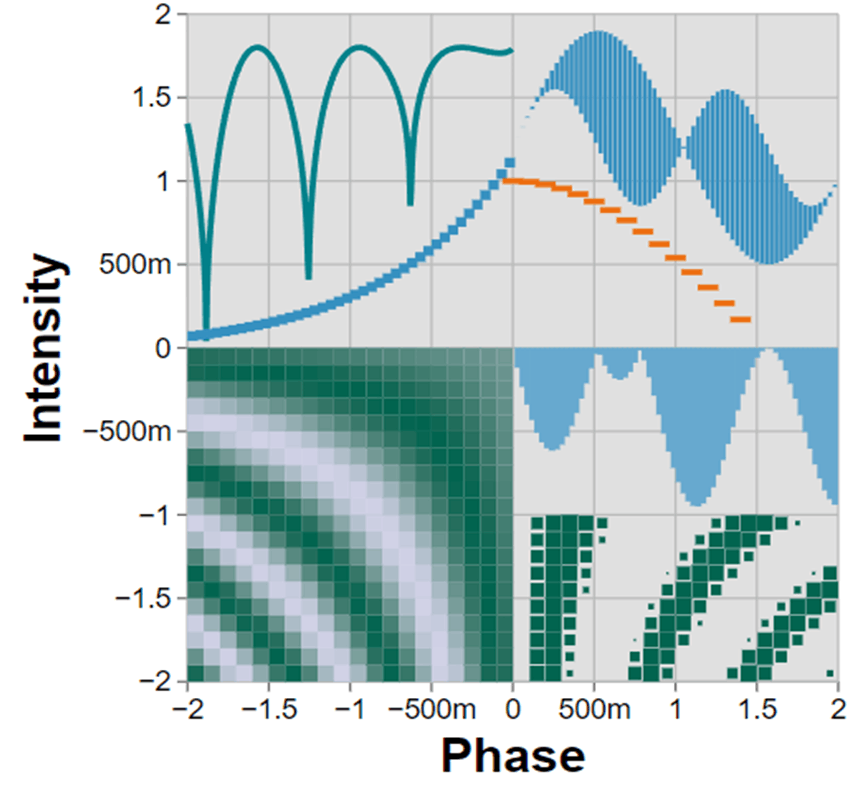
Fig 1.0
Charts components are categorized based on their type. The components are grouped as XY chart components: AreaBarChart, AreaChart, BArChart, ScatterPlot, Histogram, MarkerLineChart, FunnelChart, ColorHeatMap, AreaHeatMap, RangeBarChart, KernelDensityEstimation, LineChart.

** Fig 1.1**
Standalone chart components: PieChart, SankeyDiagram, TreeMap
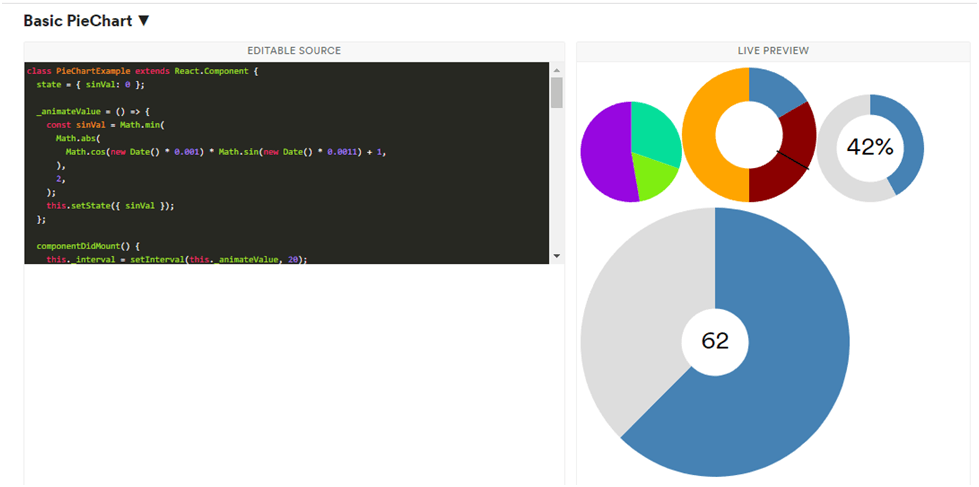
** Fig 1.2** **XY Data components: Bar, RangeRect, XLine, YLine
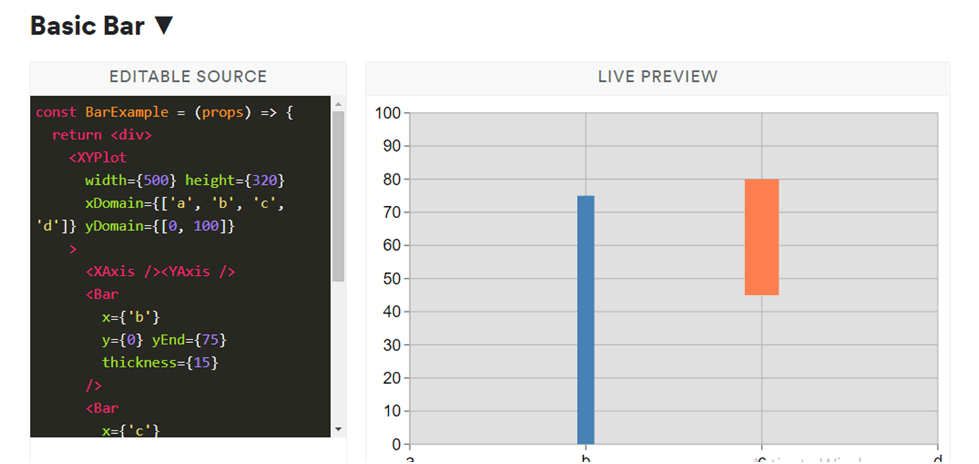
** Fig 1.3** ** XY Axis components: XAxis, XAxisLabels, XAxisTitle, XGrid, XTicks, YAxis, YAxisLabels, YAxisTitle, YGrid and YTicks.
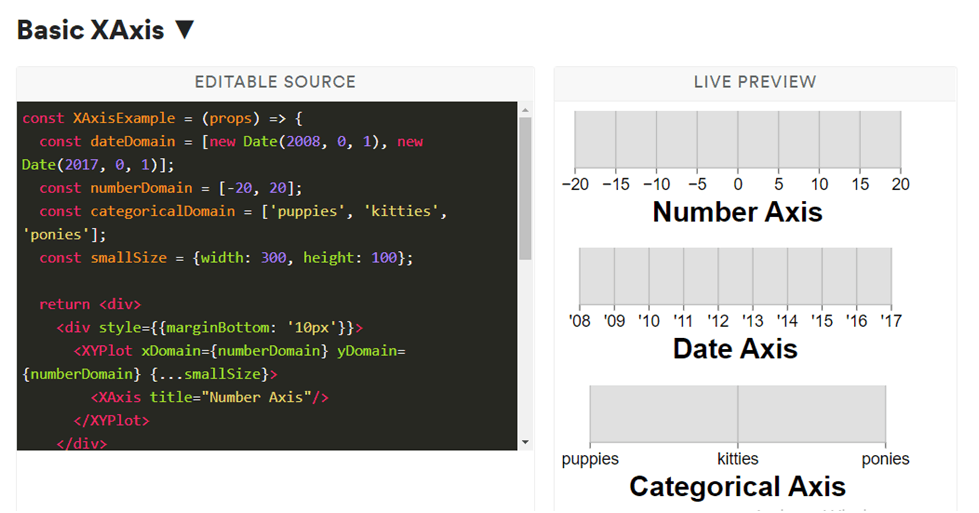
** Fig 1.4**
As the XY charts require Axial plots, we have the XY Plots.
Major Component Case Study: RangeBarChart
The RangeBarChart is a variation on the standard bar chart. Just like a normal bar chart, each bar represents a single value on the independent axis (X axis for vertical bars) and is centered on this value. However, on the dependence axis, each bar represents a range (min/max) of values, rather than always starting at zero.
Cartesian (“X/Y” –type charts) accept an array of data and represent these data with some form of SVG marks on a 2-dimentional X/Y coordinate plane. RangeBArChart is not meant to be rendered on its own but should instead always be wrapped in a component. is a wrapper which iterates over all of its charts and generates a common set of X and Y scales, which are shared and provided to its children as scaleprops. XYPlot also accepts several other props which apply to all of its children, such as width and height.
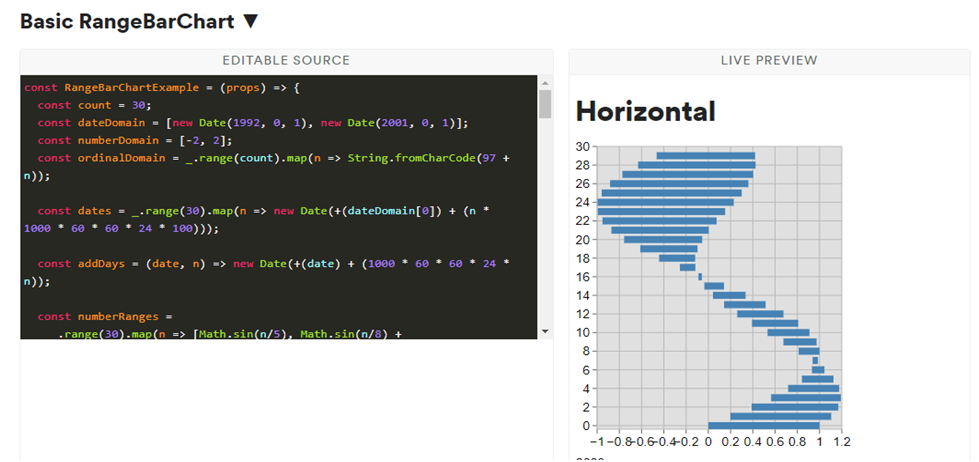
** Fig 1.5**
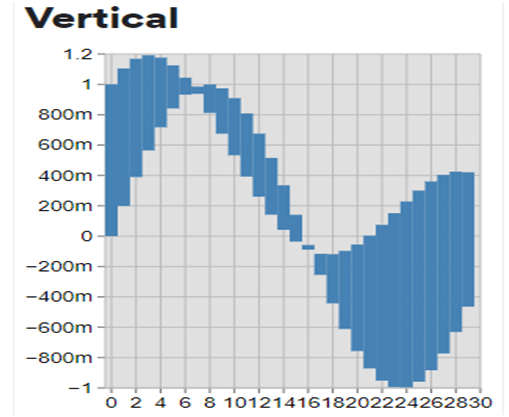
** Fig 1.6**
RangeBarChart props include:
barClassName, barLabelFormat, barStyle, DefaultValue, barThickness, onClick, onMouse
Setup Code
The ReactoChart can be installed and used on different projects . You can install individual components of the Reactochart or install the entire Reactochart Library. This might however hinder some optimization such as webpack tree-shaking.
To begin, use the npm command. npm install –save reactochart. Then import any of the Reactochart component you need. Here is an example below: First, Import LineChart from ‘reactochart/LineChart’. Also the XYPlot, XAxis, YAxis.
Outcome: Import XYPlot from ‘reactochart/XYPlot’; Import XAxis from ‘reactochart/XAxis’; Import YAxis from ‘ reactochart/YAxis’; Import LineChart from ‘reactochart/LineChart
You can install the entire Reactochart Library. Import {XYPlot, XAxis, YAxis, LineChart} from ‘reactochart’; Or Import * as Reactochart from ‘reactochart’;
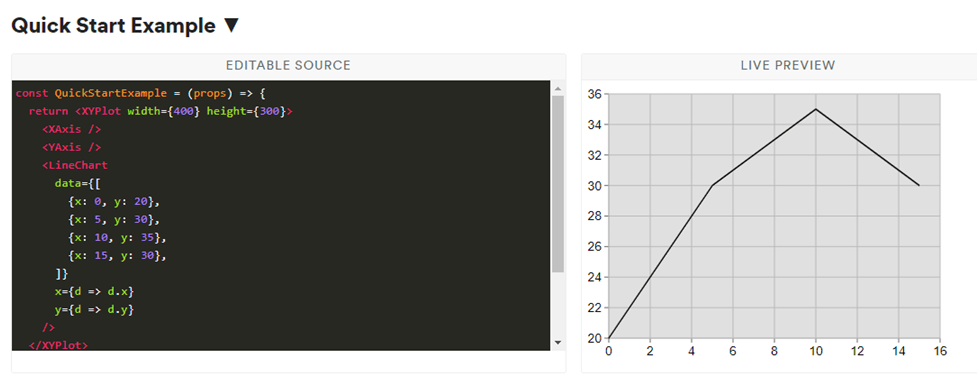
Fig 1.7
Compatibility
The Reactochart library is compatible with a number of libraries especially at point 91 which is between Safari and Edge. Reactochart can be used across browsers although varying in compatibility as seen in Fig 1.8
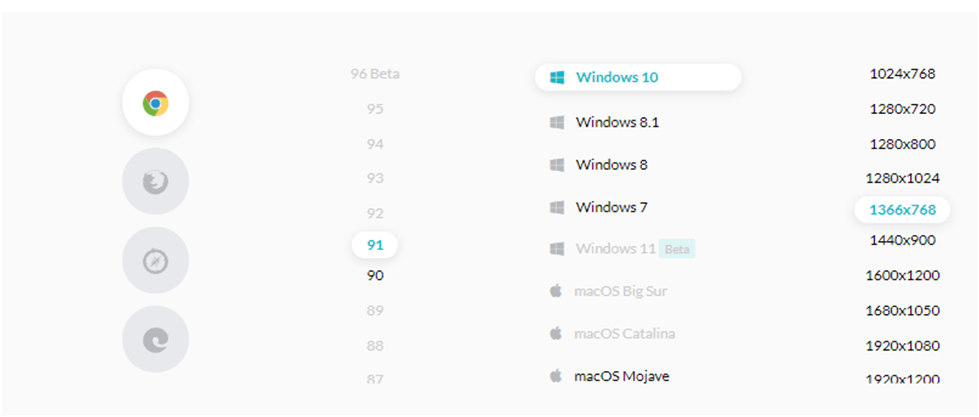
Fig 1.8 app.lambdatest.com/console/realtime
Efficieny with the development approach
The Reactochart library has been proven efficient and reliable. It can be used in different projects to implement the chart feature. It is majorly used when detailed statistical analytics is required. Although there are other chart libraries, the Reactochart works and serves its purpose adequately.
My Twitter Handle: https://twitter.com/mchelleOkonicha
My LinkedIn Handle: https://www.linkedin.com/in/buchi-michelle-okonicha-0a3b2b194/
